This tutorial explains how to use debugging options in react native application to identify the bugs or defect in android or ios application. React native offers a couple of methods that help in debugging your code.
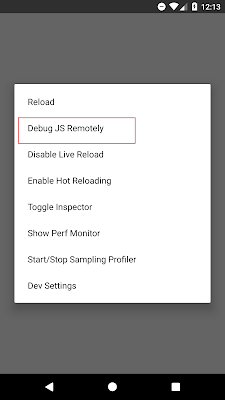
Step-1 : You can access the developer menu by shaking your device or by selecting “Shake Gesture” inside the Hardware menu in the iOS Simulator. You can also use the ⌘D keyboard shortcut when your app is running in the iOS Simulator, or ⌘M when running in an Android emulator on Mac OS and Ctrl+M on Windows and Linux. Alternatively for Android, you can run the command adb shell input keyevent 82 to open the dev menu (82 being the Menu key code).and click ‘Debug JS Remotely’ like so:

Step-2 : It should trigger the React native debugger tab to open in Chrome, as long as that’s your default browser. One thing to keep in mind as regards keeping this debugger open is that if you have to kill your app for some reason and start it again, they may slow down your app a lot when you relaunch it.
Link to open debugger manually :
http://localhost:8081/debugger-ui/
Step-3 : First perform right click and select the inspect option from the context menu, then select the console option from the chrome developer tool. After that perform the log operation in react native application and then see the results in chrome developer option console section.
- Reload − Used for reloading simulator. You can use shortcut command + R
- Debug JS Remotely − Used for activating debugging inside browser developer console.
- Enable Live Reload − Used for enabling live reloading whenever your code is saved. The debugger will open at localhost:8081/debugger-ui.
- Start Systrace − Used for starting Android marker based profiling tool.
- Show Inspector − Used for opening inspector where you can find info about your components. You can use shortcut command + I
- Show Perf Monitor − Perf monitor is used for keeping track of the performance of your app.


