
In this tutorial we are going to learn How we can implement Charts or Graphs in our React Native Application and for that I am going to use react-native-chart-kit.
Charts are beautiful visual components, that highly boost the look and feel of your mobile app. By leveraging charts as a design tool, you make your React Native app more beautiful, while also boosting the user experience. Charts are easy to read and efficiently convey data stories. Rather than using tables full of data, your app’s storytelling means are way more powerful with React Native Charts components.
Install Dependency
npm install react-native-chart-kit

npm install react-native-svg --save
App.js Code
import * as React from 'react';
import { Text, View, StyleSheet, Dimensions, ScrollView } from 'react-native';
import {
LineChart,
BarChart,
PieChart,
} from 'react-native-chart-kit';
const linedata = {
labels: ['January', 'February', 'March', 'April', 'May', 'June'],
datasets: [
{
data: [20, 45, 28, 80, 99, 43],
strokeWidth: 2, // optional
},
],
};
const barData = {
labels: ['January', 'February', 'March', 'April', 'May', 'June'],
datasets: [
{
data: [20, 45, 28, 80, 99, 43],
},
],
};
const pieData = [
{
name: 'Seoul',
population: 21500000,
color: 'rgba(131, 167, 234, 1)',
legendFontColor: '#7F7F7F',
legendFontSize: 15,
},
{
name: 'Toronto',
population: 2800000,
color: '#F00',
legendFontColor: '#7F7F7F',
legendFontSize: 15,
},
{
name: 'Beijing',
population: 527612,
color: 'red',
legendFontColor: '#7F7F7F',
legendFontSize: 15,
},
{
name: 'New York',
population: 8538000,
color: '#ffffff',
legendFontColor: '#7F7F7F',
legendFontSize: 15,
},
{
name: 'Moscow',
population: 11920000,
color: 'rgb(0, 0, 255)',
legendFontColor: '#7F7F7F',
legendFontSize: 15,
},
];
export default class App extends React.Component {
render() {
return (
<ScrollView>
<View>
<Text>
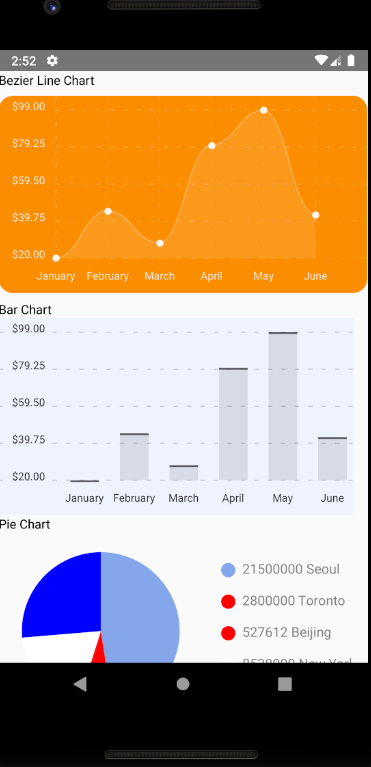
Bezier Line Chart
</Text>
<LineChart
data={linedata}
width={Dimensions.get('window').width} // from react-native
height={220}
yAxisLabel={'$'}
chartConfig={{
backgroundColor: '#e26a00',
backgroundGradientFrom: '#fb8c00',
backgroundGradientTo: '#ffa726',
decimalPlaces: 2, // optional, defaults to 2dp
color: (opacity = 1) => `rgba(255, 255, 255, ${opacity})`,
style: {
borderRadius: 16
}
}}
bezier
style={{
marginVertical: 8,
borderRadius: 16
}}
/>
<Text>Bar Chart</Text>
<BarChart
// style={graphStyle}
data={barData}
width={Dimensions.get('window').width - 16}
height={220}
yAxisLabel={'$'}
chartConfig={{
backgroundColor: '#1cc910',
backgroundGradientFrom: '#eff3ff',
backgroundGradientTo: '#efefef',
decimalPlaces: 2, // optional, defaults to 2dp
color: (opacity = 255) => `rgba(0, 0, 0, ${opacity})`,
style: {
borderRadius: 16,
},
}}
/>
<Text>Pie Chart</Text>
<PieChart
data={pieData}
width={Dimensions.get('window').width - 16}
height={220}
chartConfig={{
backgroundColor: '#1cc910',
backgroundGradientFrom: '#eff3ff',
backgroundGradientTo: '#efefef',
decimalPlaces: 2, // optional, defaults to 2dp
color: (opacity = 255) => `rgba(0, 0, 0, ${opacity})`,
style: {
borderRadius: 16,
},
}}
accessor="population"
backgroundColor="transparent"
paddingLeft="15"
absolute
/>
</View>
</ScrollView>
)
}
}
const styles = StyleSheet.create({
container: {
flex: 1,
justifyContent: 'center',
padding: 8,
paddingTop: 30,
backgroundColor: '#ecf0f1',
},
});